
A liquidation map is a model, not a fact: how to read it alongside live liquidations
A liquidation map does not show real positions. It is a model, an estimate of the prices at which leveraged positions may be waiting. It is calculated from open interest, the ratio of long to short accounts, candles and an assumed leverage distribution. Exchanges do not publish where their clients’ liquidation prices are. Only the liquidations exchanges report as they happen, and the totals for the whole day, are facts. So read the map like a weather forecast: it tells you where it may rain, and whether it is actually raining you check in live liquidations.
Author: Rafał · Updated:
What is a liquidation map and what doesn’t it show?
Liquidation is the forced closing of a leveraged position. The exchange does this when, after a loss, the margin on the position falls below the required minimum. A long gets wiped out when the price falls, a short when it rises.
Every position has its own liquidation price. The exchange and the position’s owner know it, but nobody publishes it. Publicly you only see the total: how much money sits in open contracts. You cannot see who entered, at what price and with what leverage.
A liquidation map tries to reconstruct what you cannot see. Our liquidation map works it out like this:
- it takes hourly open interest (OI) of perpetual (no-expiry) contracts and candles from the last 30 days from OKX,
- it treats every increase in open interest as new positions opened at that hour’s closing price,
- it splits them into longs and shorts according to the ratio of long to short accounts,
- it spreads them across five leverage levels: 10× (30%), 20× (25%), 25×, 50× and 100× (15% each),
- it approximates the liquidation level as the entry price reduced (long) or increased (short) by the fraction 1/leverage (at 10× by 10%, at 100× by 1%),
- when open interest falls, it shrinks all levels proportionally, and treats a level the price has passed through as liquidated.
Every point on this list is an assumption, not a measurement. Where open interest comes from and what funding (a periodic payment between longs and shorts) says about the crowd is explained simply in the guide Open interest and funding for beginners (opens in a new tab) (in Polish).
Why is a liquidation map an estimate rather than a list of positions?
A model is only as good as its assumptions. A liquidation map has at least four places where reality may look different.
First, the leverage distribution is assumed up front. Nobody outside the exchange knows how many positions were opened at 10× and how many at 100×. If the crowd trades more cautiously than the model assumes, the real liquidation prices sit much further from the price.
Second, the long/short ratio is a ratio of accounts, not money. OKX’s API gives the ratio of the number of users who are net long to the number who are net short. An account with 10 million dollars counts the same as one with 100 dollars.
Third, the liquidation price depends on margin. The exchange closes the position before the loss eats all the margin, because maintenance margin has to remain (see margin). In cross mode, i.e. with shared margin, the liquidation price is calculated from the whole account balance, the maintenance margin on other contracts and their unrealized PnL. That is how the formula in Binance’s documentation describes it. This data is not available in any public source.
Fourth, our map sees one exchange. It shows the shape of the market, not the full amount of positions across all exchanges.
A worked example (made up, but you can check the maths yourself). You buy 1 bitcoin on a contract at 100,000 dollars (a position worth 100,000 dollars), with 10× leverage and margin on this position only. The model will put your liquidation at 90,000 dollars, i.e. 10% lower. Let’s assume a maintenance margin of 0.5% (each exchange publishes its own rates in tables). Then:
- with 10× leverage the exchange will close the position at around 90,450 dollars, not 90,000,
- with 100× leverage at around 99,500 dollars, i.e. after a 0.5% drop, while the model will draw it at a 1% drop,
- in cross mode with 40,000 dollars in the account, the same 10× position will survive a drop to about 60,300 dollars, almost 40% lower.
Same entry price, three different liquidation prices, depending on leverage and margin mode. The gap is not a calculation error: the map is an estimate because without the exchange’s data there is no other way. Before you open a position, work out your liquidation price in the leverage calculator.
What is a fact: live liquidations and 24-hour data?
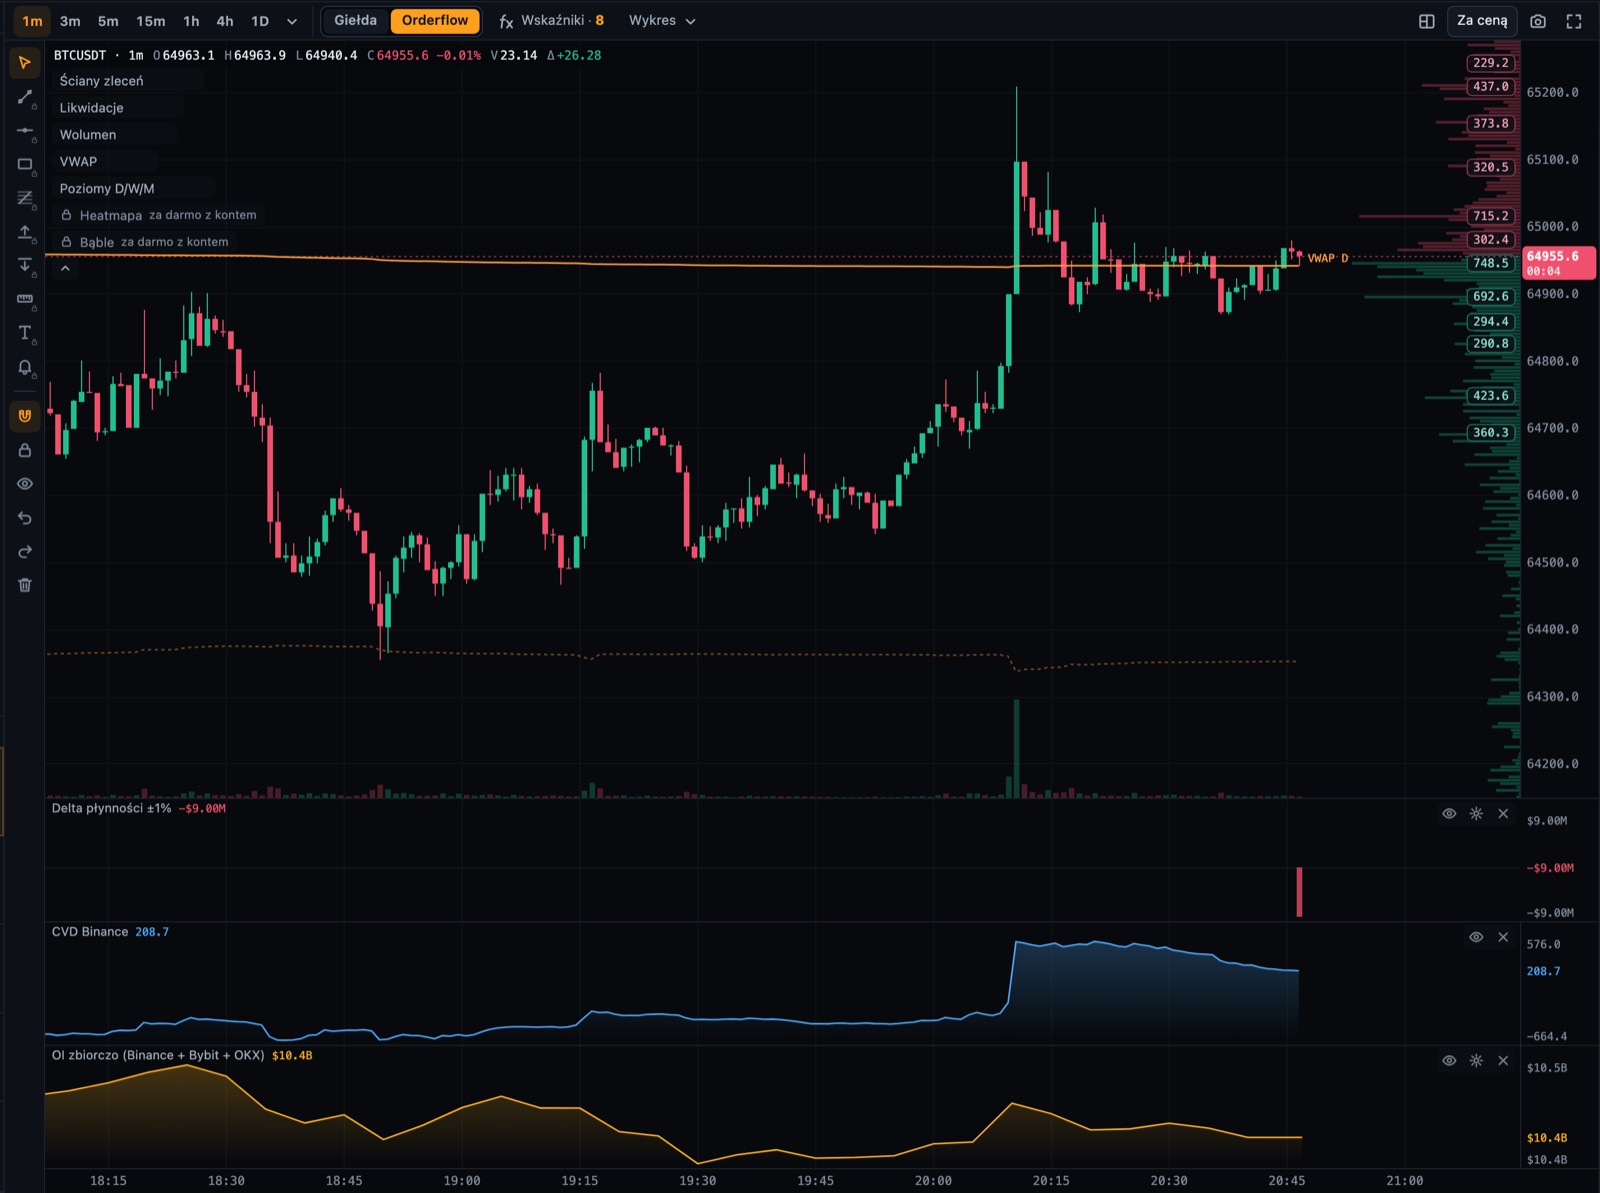
A fact is a liquidation an exchange has reported. It has a time, a side (long or short), an amount, a coin, a price and an exchange. Reported liquidations, one after another, appear in the “Likwidacje na żywo” (live liquidations) panel in HornX Depth (screenshot below). HornX Depth (opens in a new tab) is a free in-browser order-flow terminal: orders, trades and liquidations from more than 30 exchanges (Polish interface). The panel collects liquidations from 11 sources that publish them and works without an account.
Even facts have limits, though. In its public stream, Binance reports at most one liquidation per second for each contract. In April 2026, Binance changed the description in its documentation: it is meant to be the largest liquidation in that second, not the latest. When a hundred positions are wiped out on the same contract within one second, one of them reaches the stream. That is why totals from such data are a lower bound.
It is easiest to see on the record day in crypto history. On 10 October 2025, CoinGlass counted 19.13 billion dollars of liquidations within 24 hours. Liquidations hit 1,618,240 traders, and almost 17 billion dollars of that amount were long positions. CoinGlass itself added that the real amount was probably much higher, precisely because of the one-liquidation-per-second limit. How such a chain reaction looks to an investor who does not use leverage is described in the guide why bitcoin can drop more than ten percent in an hour (opens in a new tab) (in Polish).
On Kryptoliczby you have three views, and each answers a different question:
- liquidation map: where liquidations may be waiting (model),
- 24h liquidations: the value of positions exchanges liquidated in the last hour, 4 hours and 24 hours, broken down by exchange and coin (fact, aggregated, CoinMarketCap data refreshed hourly),
- market depth (in Polish): a free order book heatmap where triangles show liquidations on three large derivatives exchanges as they happen (fact, live).
The map says “might”, the 24-hour data says “happened”, and live liquidations say “happening now”. Trouble starts when you read “might” as “happened”.
How to read a liquidation map alongside live liquidations, step by step?
You can test the map. Not to catch a move, but to know how much it is worth on a given market.
- Step 1. Open the BTC liquidation map and note two levels from the tiles at the top: the largest long cluster below the price and the largest short cluster above it. Work out how many percent separate them from the price.
- Step 2. Open HornX Depth in the Orderflow view (opens in a new tab). Without an account you can see candles, order walls, the trade tape and the “Likwidacje na żywo” (live liquidations) panel.
- Step 3. When the price approaches a level from the map, watch the panel. Do liquidations appear on the side the map pointed to (LONG on a drop, SHORT on a rise)? In what amounts?
- Step 4. After the move, open 24h liquidations and check whether the total on that side really grew.
- Step 5. Return to the map after its next refresh. The cluster the price passed through should be gone.
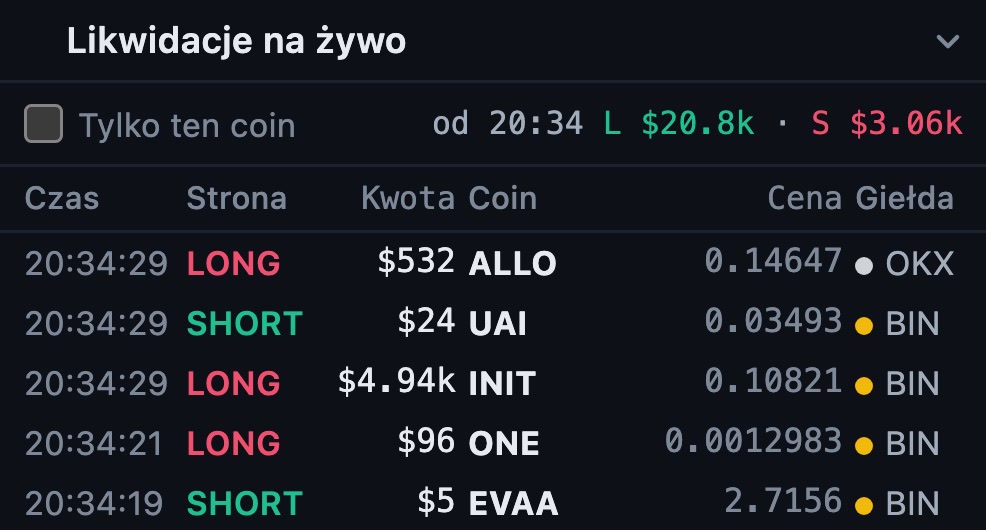
If the price passed through a bright band on the map and almost nothing happened in the panel, the model’s assumptions did not fit that market. That is information too: next time that band carries less weight.
After you create a free account, HornX Depth also shows its own liquidation map. It is a model too, calculated differently: from open interest and buyer and seller aggression on Binance every 15 minutes. Two models from different data draw different maps. That is the simplest proof that neither of them is a list of positions.
What mistakes do people make when reading a liquidation map?
Most mistakes come from one thing: reading the map as data rather than as an estimate.
- “The price has to go to the largest cluster.” A cluster is a place where a move can accelerate if the price gets there. Not a target the market must visit. Sometimes it acts like a magnet, but “sometimes” is not a signal.
- Treating the map’s amounts as real money. The amount next to a band tells you what position value the model assigned to that level. It is the result of assumptions, not account balances.
- Comparing maps from different sites as if they were two measurements. Different inputs and different assumptions produce different pictures. Don’t look for the “true” map; check which one agrees more often with live liquidations.
- Drawing conclusions from one liquidation. A single large liquidation is not a cascade. A cascade is many liquidations on one side in a short time that push the price further on their own.
- Mixing up the sides. A long gets wiped out on a drop, so long clusters sit below the price. A short gets wiped out on a rise, so short clusters sit above it.
- Using the map as a reason for leverage. The map shows other people’s risk. Your risk is your leverage and your liquidation price.
Can you build a plan from this knowledge? You can, but a plan starts with understanding the chart, risk and your own mistakes, not with a single indicator. That is what Akademia Klubu Zero teaches (a Polish-language course): 66 videos on trading from scratch, in one sequence. Before you pay, you can watch six full videos for free, without logging in or giving your email: three from the course itself and the first videos of Scalping, Psychologia Zero and Fale Zero. If you don’t want a course for now, the free tools are enough: the liquidation map, 24-hour liquidations and live market depth (in Polish).
Watch 6 Akademia Klubu Zero videos for free (in Polish) → (opens in a new tab)
Frequently asked questions
Does a liquidation map show traders’ real positions?
Why do different sites show different liquidation maps?
Are live liquidations complete data?
Does the price always go to the largest cluster on the map?
Where can I see live liquidations for free?
Sources
- Binance Developer Docs: Liquidation Order Streams (USDⓈ-M contracts), at most one liquidation per contract within 1000 ms, according to the current description the largest (opens in a new tab) (as of 2026-11-15)
- Binance Developer Docs: derivatives change log, entry of Apr 10, 2026 (liquidation stream description changed from “latest” to “largest” within the 1000 ms window) (opens in a new tab) (as of 2026-11-15)
- Binance: How to Calculate Liquidation Price of USDⓈ-M Futures Contracts (liquidation price formula, cross and isolated mode, maintenance margin; updated Dec 31, 2025) (opens in a new tab) (as of 2026-11-15)
- OKX API v5, trading statistics: contract open interest history and long/short ratio (number of net-long users to number of net-short users) (opens in a new tab) (as of 2026-11-15)
- Decrypt, Oct 11, 2025: 19.13 billion dollars of liquidations in 24 hours according to CoinGlass, 1,618,240 traders, note on the one-liquidation-per-second limit (opens in a new tab) (as of 2026-11-15)
- HornX Depth: Data sources and limits (11 liquidation sources, live liquidations as a measurement, the liquidation map as a model; updated Nov 12, 2026; in Polish) (opens in a new tab) (as of 2026-11-15)
- CoinMarketCap: derivatives market liquidations (data source for the 24h liquidations page) (opens in a new tab) (as of 2026-11-15)
Educational material, not investment advice. Leveraged contracts are very risky: you can quickly lose the entire amount you deposited.
Worth reading next
- leverage and liquidation: how to calculate risk (opens in a new tab) — How much you can lose on a futures contract and when the exchange will close your position.
- liquidation price calculator (opens in a new tab) — The price at which the exchange will close your leveraged position.
- crypto scalping course (opens in a new tab) — Short-term trades with a plan and a hard loss limit.
Learn with the Klub Zero family
Recommended Courses, books and community from the creators of kryptoliczby.pl
Leverage under control
Every Sunday: liquidations, funding and the weekly plan, before the market catches your position off guard.